Fig. 2
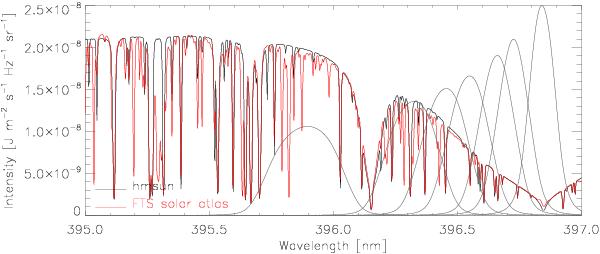
Different transmission profiles ( )
of the interference filter for the tilt angles used. The FTS atlas (Neckel 1999) is shown in red, together with the
synthetic spectrum from HolMul with blends (black continuous line) computed at
μ = 0.953. The filter profiles are normalized to the peak
transmission of the narrowest profile in the plot, over the line core, that
corresponds to the smallest tilt angle used. The large blend at 396.15 nm is from
Al i.
)
of the interference filter for the tilt angles used. The FTS atlas (Neckel 1999) is shown in red, together with the
synthetic spectrum from HolMul with blends (black continuous line) computed at
μ = 0.953. The filter profiles are normalized to the peak
transmission of the narrowest profile in the plot, over the line core, that
corresponds to the smallest tilt angle used. The large blend at 396.15 nm is from
Al i.
Current usage metrics show cumulative count of Article Views (full-text article views including HTML views, PDF and ePub downloads, according to the available data) and Abstracts Views on Vision4Press platform.
Data correspond to usage on the plateform after 2015. The current usage metrics is available 48-96 hours after online publication and is updated daily on week days.
Initial download of the metrics may take a while.