Fig. 4
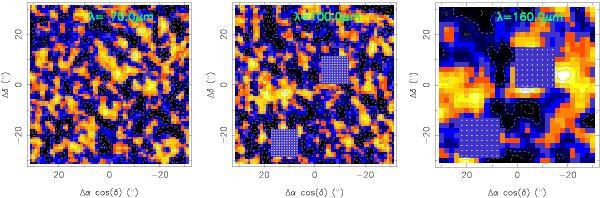
Maps of residuals for the best fit models of the disk to the PACS images at 70, 100, and 160 μm from left to right. The post-fit residuals are between ± 3.5σ0, coded as black, blue, orange, yellow and white over this range (σ0 is the same noise rms as used for contours in Fig. 1 but the color scale is not the same as in Fig. 1). In zooming the electronic version, the contours apparent in these maps are −3, −2, −1, 1, 2, 3 σ0 (dashed contours are negative levels). The two background sources are masked in the 100 and 160 μm images as the dotted squares show.
Current usage metrics show cumulative count of Article Views (full-text article views including HTML views, PDF and ePub downloads, according to the available data) and Abstracts Views on Vision4Press platform.
Data correspond to usage on the plateform after 2015. The current usage metrics is available 48-96 hours after online publication and is updated daily on week days.
Initial download of the metrics may take a while.