Fig. 1
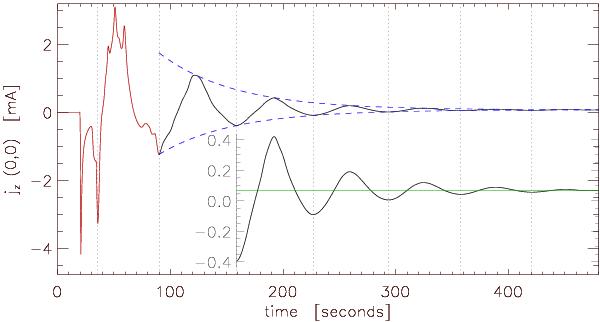
Time evolution of jz(0,0,t) (measured in milliAmps) for 0 ≤ t ≤ 480 s. Red line indicates impulsive phase and black line indicates stationary phase. Insert shows the same time evolution over 158.9 ≤ t ≤ 480 s (same horizontal axis, different vertical axis). The black dotted lines indicate the formation times of all the horizontal current sheets and the green line indicates jfinal = 0.8165 j0 = 6.5 × 10⁻⁵ A. The blue dashed lines indicate an exponentially-damped envelope max(jz)|stationary × e−λt + jfinal and min(jz)|stationary × e−λt + jfinal where λ = −0.015 s-1.
Current usage metrics show cumulative count of Article Views (full-text article views including HTML views, PDF and ePub downloads, according to the available data) and Abstracts Views on Vision4Press platform.
Data correspond to usage on the plateform after 2015. The current usage metrics is available 48-96 hours after online publication and is updated daily on week days.
Initial download of the metrics may take a while.