Fig. 16
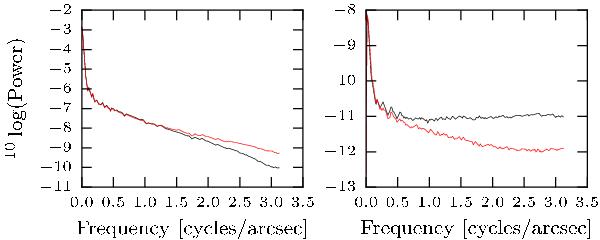
Angular averaged power spectrum of the deconvolved (black) and inverted (red) solutions of Stokes I at 6302.55 Å, approximately half way into the Fe I line at 6302.5 Å. Clearly visible is the increased power of the inverted result in the high-frequency range of the power spectrum.
Current usage metrics show cumulative count of Article Views (full-text article views including HTML views, PDF and ePub downloads, according to the available data) and Abstracts Views on Vision4Press platform.
Data correspond to usage on the plateform after 2015. The current usage metrics is available 48-96 hours after online publication and is updated daily on week days.
Initial download of the metrics may take a while.