Fig. 1
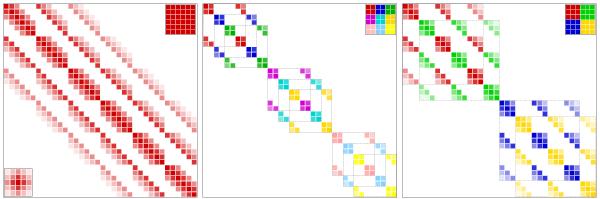
Full matrix for a grid of 6 × 6 pixels (left), approximated by 9 blocks of 2 × 2 pixels (middle) and 4 blocks of 3 × 3 pixels (right). The cost increases rapidly with the number of pixels N, as the inversion of the resulting matrix scales ∝ N3. In the upper right corner, the spatial distribution of the pixels is indicated by the color of the block they belong to. The full matrix has in addition the cross-correlation function, Y, inserted in the lower left corner.
Current usage metrics show cumulative count of Article Views (full-text article views including HTML views, PDF and ePub downloads, according to the available data) and Abstracts Views on Vision4Press platform.
Data correspond to usage on the plateform after 2015. The current usage metrics is available 48-96 hours after online publication and is updated daily on week days.
Initial download of the metrics may take a while.