Fig. 6
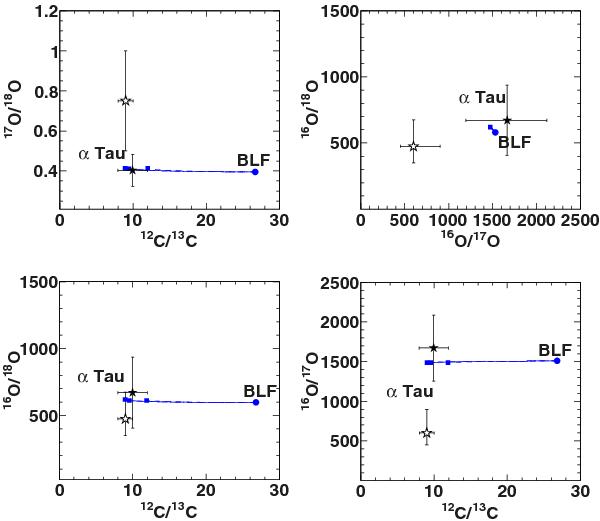
Combinations of isotopic C and O ratios for selected extra-mixing runs performed for α Tau and for a case without extra-mixing (blue spot) compared to observed data. The models and the meaning of the line types are the same as in Fig. 5. The small squares indicate the envelope isotopic mix reached by each mixing case when the model effective temperature is comparable with the observed one. At the same mixing depth, the higher the mixing rate Ṁ6, the lower the value of the carbon isotopic ratio. Open stars are the isotopic ratios derived by Harris & Lambert (1984).
Current usage metrics show cumulative count of Article Views (full-text article views including HTML views, PDF and ePub downloads, according to the available data) and Abstracts Views on Vision4Press platform.
Data correspond to usage on the plateform after 2015. The current usage metrics is available 48-96 hours after online publication and is updated daily on week days.
Initial download of the metrics may take a while.