Fig. 9
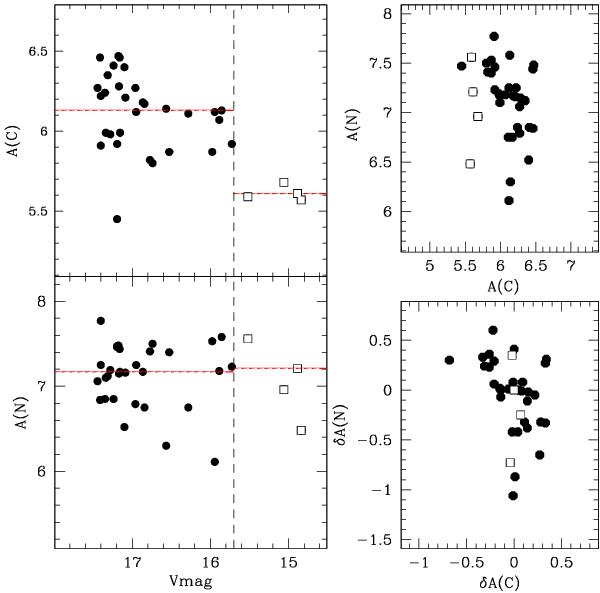
Correction of the C-N anticorrelation for evolutionary effect. The left panels show the runs of A(C) and A(N) vs. V magnitude for spectroscopic targets. The vertical dashed line marks the RGB bump position. The red continuous red line indicates median value of the carbon and nitrogen abundance for stars in two bins of magnitude (V < 15.7 and V ≥ 15.7 mag). The top right panel shows the derived C-N anticorrelation uncorrected for carbon decline (and nitrogen enhancement) due to evolution of the stars along the RGB. The bottom right panel shows the corrected C-N anticorrelation. In this case we plotted the difference of A(C) and A(N) from the median abundance value shown in the left panels (see text for further details).
Current usage metrics show cumulative count of Article Views (full-text article views including HTML views, PDF and ePub downloads, according to the available data) and Abstracts Views on Vision4Press platform.
Data correspond to usage on the plateform after 2015. The current usage metrics is available 48-96 hours after online publication and is updated daily on week days.
Initial download of the metrics may take a while.