Fig. 8
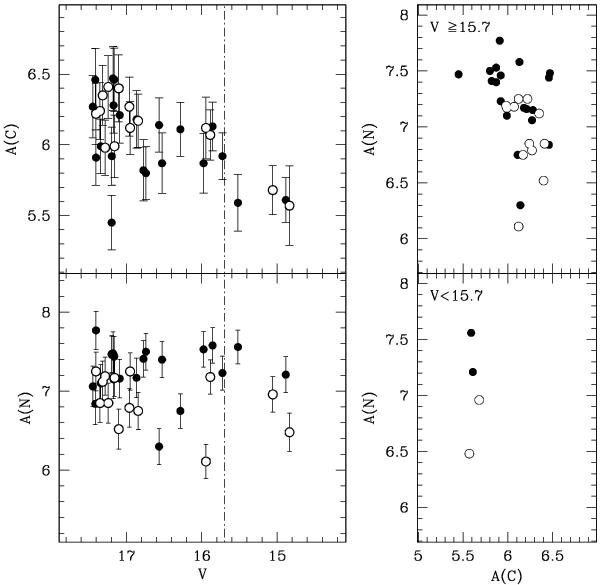
Left panels: derived C and N abundances are plotted against the V magnitude for M 2 RGB stars. The dot-dashed vertical lines indicate the luminosity at which the RGB bump occurs (V ~ 15.7 mag). CN-strong and CN-weak stars, as defined in Sect. 3, are shown as filled and open symbols, respectively. Right panel: CN-strong and CN-weak stars (see Sect. 3) are plotted in the A(C) vs. A(N) plane for stars with luminosities fainter (top) and brighter (bottom) than the RGB bump. The color code is consistent with the left panel.
Current usage metrics show cumulative count of Article Views (full-text article views including HTML views, PDF and ePub downloads, according to the available data) and Abstracts Views on Vision4Press platform.
Data correspond to usage on the plateform after 2015. The current usage metrics is available 48-96 hours after online publication and is updated daily on week days.
Initial download of the metrics may take a while.