Fig. 4
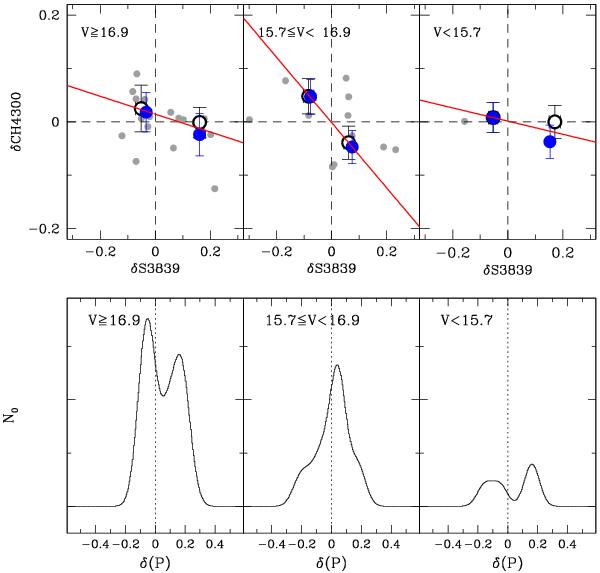
Upper panel: anticorrelation plot for the CN and CH band strengths in three magnitude bins (V ≥ 16.9 mag, 15.7 ≤ V < 16.9 mag and V < 15.7 mag). Gray dots show measurements for stars. CH weak and CH strong stars are separated by the horizontal dashed line, and their centroids with 1σ are marked as large white dots. CN strong and weak stars are separated by the vertical dashed line, and their centroids with their 1σ are shown as large blue dots. The red continuous line connects the locus equidistant from CH-strong/CN-weak centroids and CH-weak/CN-strong ones.The generalized histograms in the bottom panels represent the distribution of distances of projected points from the origin P (see text for details).
Current usage metrics show cumulative count of Article Views (full-text article views including HTML views, PDF and ePub downloads, according to the available data) and Abstracts Views on Vision4Press platform.
Data correspond to usage on the plateform after 2015. The current usage metrics is available 48-96 hours after online publication and is updated daily on week days.
Initial download of the metrics may take a while.