Fig. 13
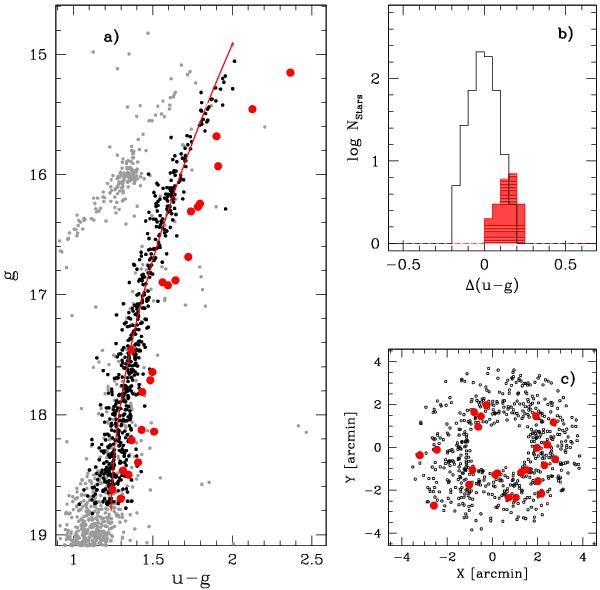
a) u, (u − g) CMD from An et al. (2008)corrected photometry zoomed in around the RGB. Stars selected as red in Fig. 12 are plotted as red circles, while the red continuous line is the fiducial obtained in the way described in the text. Panels b) show the color distribution in the (u − g) color, while panel c) shows spatial distribution of the selected red stars.
Current usage metrics show cumulative count of Article Views (full-text article views including HTML views, PDF and ePub downloads, according to the available data) and Abstracts Views on Vision4Press platform.
Data correspond to usage on the plateform after 2015. The current usage metrics is available 48-96 hours after online publication and is updated daily on week days.
Initial download of the metrics may take a while.