Fig. 12
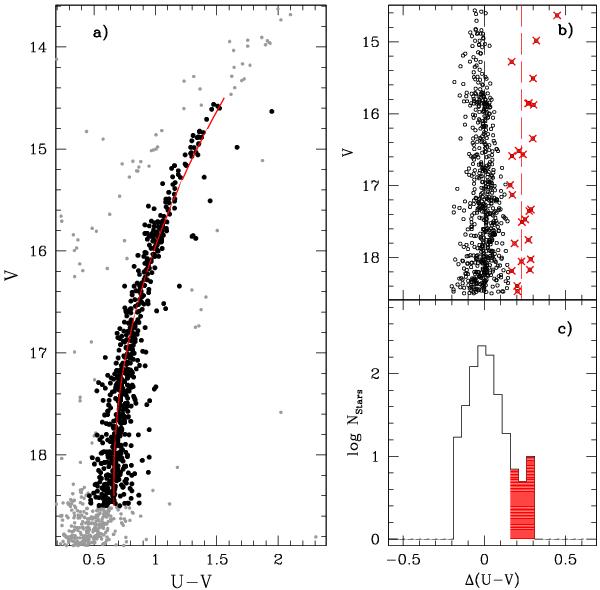
a) U,V CMD from DOLORES images is shown in gray. Selected RGB stars are plotted as black dots, while the red continuous line is the fiducial obtained in the way described in the text. Panels b) and c) show the rectified RGB in function of the color difference and the histogram color distribution, respectively (see the text for details).
Current usage metrics show cumulative count of Article Views (full-text article views including HTML views, PDF and ePub downloads, according to the available data) and Abstracts Views on Vision4Press platform.
Data correspond to usage on the plateform after 2015. The current usage metrics is available 48-96 hours after online publication and is updated daily on week days.
Initial download of the metrics may take a while.