Fig. 11

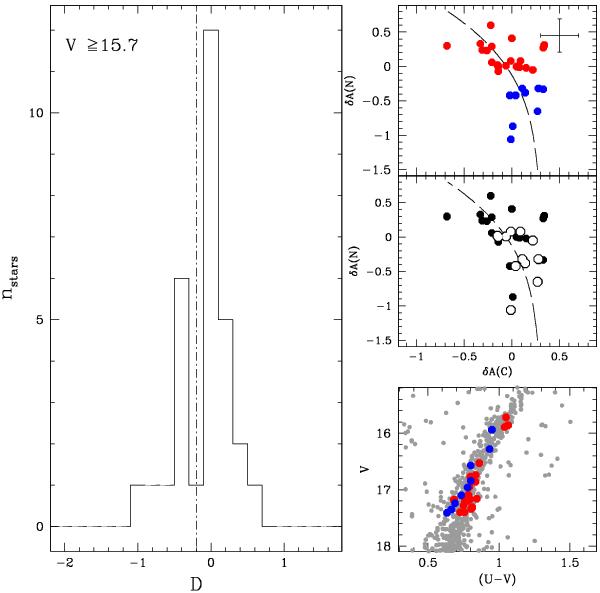
Left panel: distribution of the projected distance D of stars with V ≥ 16.9 on the fiducial plotted in the top right panel. The dotted-dashed line separates stars belonging to the two different N groups. Top right: corrected C-N anticorrelation for stars with V ≥ 15.7. We tentatively discriminated between first (blue) and second (red) populations. The error bar represents the typical errors on A(C) and A(N). Middle right: CN-strong and CN-weak stars are plotted in the δA(C)-δA(N) plane. Bottom right: first- and second-generation stars are superimposed to V, (U − V) CMD of M 2. The color code is used consistently in each panel.
Current usage metrics show cumulative count of Article Views (full-text article views including HTML views, PDF and ePub downloads, according to the available data) and Abstracts Views on Vision4Press platform.
Data correspond to usage on the plateform after 2015. The current usage metrics is available 48-96 hours after online publication and is updated daily on week days.
Initial download of the metrics may take a while.


