Fig. 9
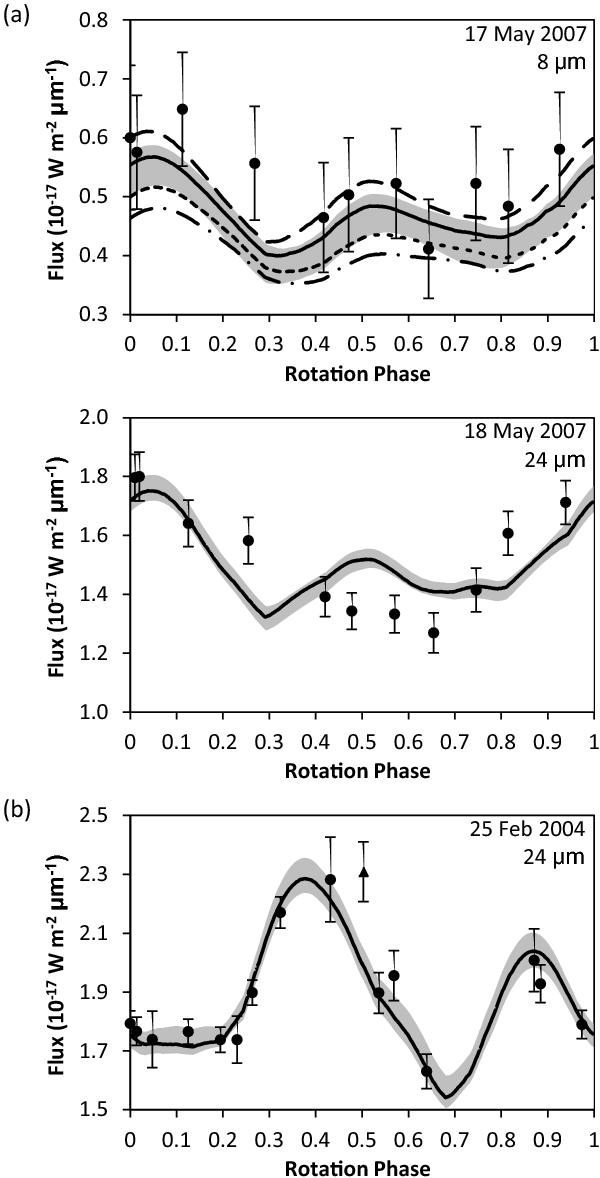
ATPM fits to the 67P/C-G a) Kelley et al. (2009) data set; and b) Lamy et al. (2008) data set. The data points are shown by the markers where their error bars represent the total absolute 1-σ uncertainty, and the model fits are shown by the lines. The triangle represents a data point that is more than a 3-σ error bar away from the best model fit. The long-dashed, solid, short-dashed, and long-dashed-dotted lines represent thermal inertia values of 0, 4, 10, and 15 J m-2 K-1 s−1/2 respectively. The greyed out regions represent the 3-σ range of possible thermal-IR fluxes caused by non-uniform surface roughness for a thermal inertia of 4 J m-2 K-1 s−1/2.
Current usage metrics show cumulative count of Article Views (full-text article views including HTML views, PDF and ePub downloads, according to the available data) and Abstracts Views on Vision4Press platform.
Data correspond to usage on the plateform after 2015. The current usage metrics is available 48-96 hours after online publication and is updated daily on week days.
Initial download of the metrics may take a while.