Fig. 6
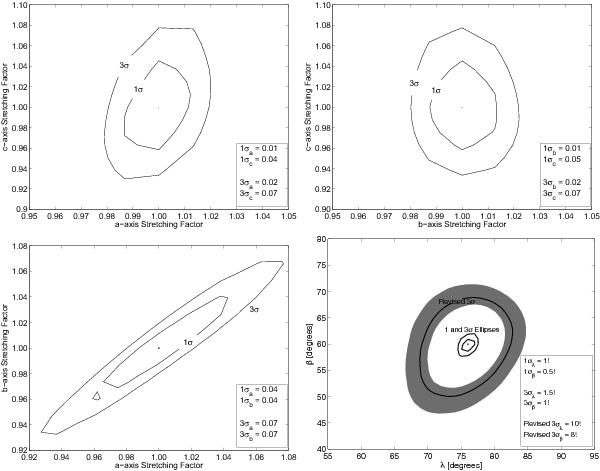
To investigate how “flexible” we can be with our best-fit shape while still producing a statistically meaningful fit to the data, we used our best-fit shape model and transformed the relative sizes of the axial dimensions of the model by stretching the model at each principal axis at random increments to include all realistic axial ratios. We then took all the new shape model permutations to generate new sets of model lightcurves for comparison with the data via chi-squared fitting. We find that a, b, and c can vary by as much as 7%, and still result in a statistically meaningful fit, at the 3-σ level. Lower right panel: given this measure of flexibility in the shape, we find that the uncertainties in the pole coordinates are revised upwards to ~±10°, indicated by the outer curve. The grey band indicates how the outer curve can vary when the sidereal rotation period is allowed to vary within its associated uncertainty. See Sect. 3.1 for full details.
Current usage metrics show cumulative count of Article Views (full-text article views including HTML views, PDF and ePub downloads, according to the available data) and Abstracts Views on Vision4Press platform.
Data correspond to usage on the plateform after 2015. The current usage metrics is available 48-96 hours after online publication and is updated daily on week days.
Initial download of the metrics may take a while.