Fig. 4
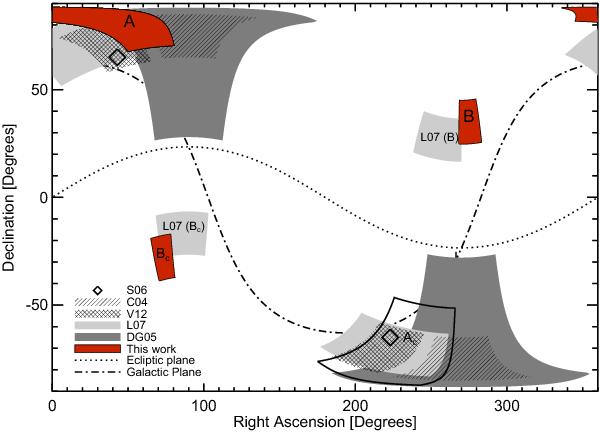
Comparison of our rotation pole with others from the literature. For consistency with other authors, mainly Lamy et al. (2007), we compare the various measurements in RA-Dec space. We first converted all previous values to Ecliptic coordinates if not done so already, then took the regions defined by these values and their associated uncertainties and mapped each region onto the celestial sphere. Key: S06 – Schleicher (2006), C04 – Chesley (2004), V12 – Vincent et al. (2012), L07 – Lamy et al. (2007), DG05 – Davidsson & Gutierrez (2005). Our primary solution at λ = 78° and β = + 58° (or RA = 51°, Dec = +79° – Solution A), is in excellent agreement with those values determined from completely independent methods. We have a 2nd unrelated solution at λ = 278° and β = + 58° (or RA = 275°, Dec = +35° – Solution B), which is well outside the range of all the other solutions. With the constraints of the other studies in mind, we discount Solution B. An inherent property of lightcurve inversions is the inevitable existence of “conjugate” solutions, z-axis “mirrors” of the best fit shape model(s), for which alternate best-fit pole solutions are possible (i.e. at λ ± 180°, Kaasalainen & Lamberg 2006). For completeness, we investigated these conjugates by generating the mirrored shape models for each of the two best fit models (at Solutions A+B in Fig. 3), to see where their preferred pole solutions lie (marked as Ac and Bc on the plot). We find that these solutions result in much poorer fits to the data, especially solution Ac, which is barely defined at all. Note that the Lamy et al. (2007) value is also based on lightcurve inversion, but on just a small subset of the data used here. They also find a 2nd solution and its conjugate, marked as “L07 (B)” and “L07 (Bc)”, respectively.
Current usage metrics show cumulative count of Article Views (full-text article views including HTML views, PDF and ePub downloads, according to the available data) and Abstracts Views on Vision4Press platform.
Data correspond to usage on the plateform after 2015. The current usage metrics is available 48-96 hours after online publication and is updated daily on week days.
Initial download of the metrics may take a while.