Fig. 3
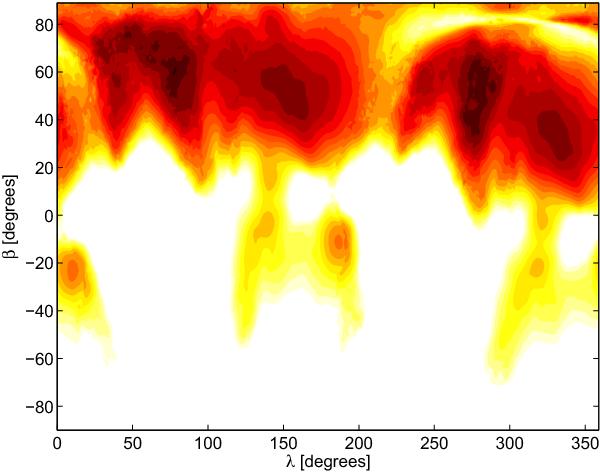
Contour plot showing the expected location of the rotation pole produced by inverting the lightcurves at each potential pole location. Darker colours here indicate lower chi-squared values. Ecliptic latitude and longitude are denoted by β and λ, respectively. The plot indicates that the pole is most likely located at high latitude, with two prominent and well-defined minima at λ = 78° and β = + 58° and a 2nd unrelated solution at λ = 278° and β = + 58°. (A colour version of this figure is available online.)
Current usage metrics show cumulative count of Article Views (full-text article views including HTML views, PDF and ePub downloads, according to the available data) and Abstracts Views on Vision4Press platform.
Data correspond to usage on the plateform after 2015. The current usage metrics is available 48-96 hours after online publication and is updated daily on week days.
Initial download of the metrics may take a while.