Fig. 2
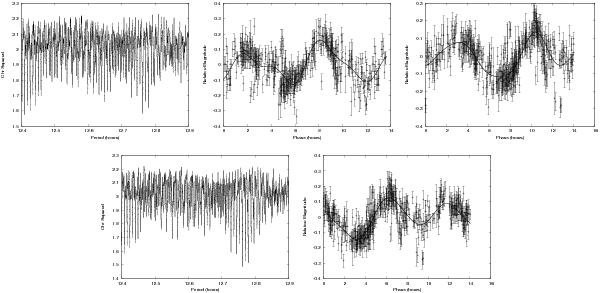
Upper panels: left – periodogram produced via least-squares fitting of a Fourier series to the raw lightcurve data. The most likely period solutions are 12.40971 ± 0.00005 h and 12.76236 ± 0.00006 h. Middle and right – folded lightcurves of the uncorrected data points for each of these two best-fit rotation periods. The fit in the 12.41 h case is unconvincing with various datasets not following the phase of the folded curve. The fit for the 12.76 h case is better, but can be further improved by correcting for the differing observational geometry between the various datasets. Lower left: periodogram produced via least-squares fitting of a Fourier series to the lightcurve data which has been corrected for the movement of the PAB. In this case the most likely solution was 12.76137 ± 0.00006 h. Lower right: folded lightcurve using the data corrected for the movement of the PAB vector. The scatter and phasing of the datapoints is improved, leading to a more reliable period measurement.
Current usage metrics show cumulative count of Article Views (full-text article views including HTML views, PDF and ePub downloads, according to the available data) and Abstracts Views on Vision4Press platform.
Data correspond to usage on the plateform after 2015. The current usage metrics is available 48-96 hours after online publication and is updated daily on week days.
Initial download of the metrics may take a while.