Fig. 1
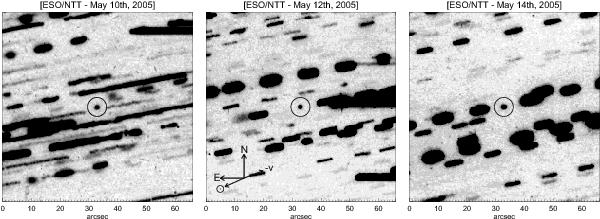
Composite R-filter images obtained at the NTT in May 2005. Each panel consists of 71 × 100 s, 123 × 100 s, and 82 × 100 s, images stacked according to the comet’s projected rate of motion. In each case, as with all our data, the comet appears as a sharp point source on our images. Celestial North and East are marked along with the projected solar direction and heliocentric velocity vectors.
Current usage metrics show cumulative count of Article Views (full-text article views including HTML views, PDF and ePub downloads, according to the available data) and Abstracts Views on Vision4Press platform.
Data correspond to usage on the plateform after 2015. The current usage metrics is available 48-96 hours after online publication and is updated daily on week days.
Initial download of the metrics may take a while.