Free Access
Fig. 3
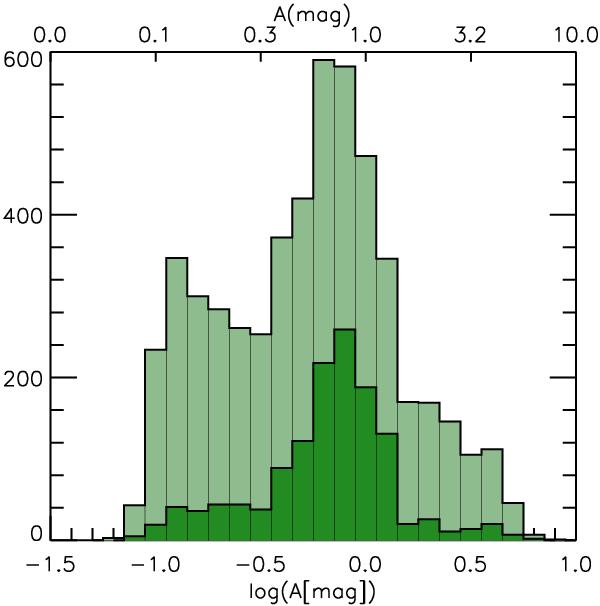
Histogram of amplitudes (calculated as the difference between the magnitude at minimum and the magnitude at maximum of the light curve) with a peak of the distribution at around 0.84 mag. In dark green are represented the sources for which we have determined a period in this work.
Current usage metrics show cumulative count of Article Views (full-text article views including HTML views, PDF and ePub downloads, according to the available data) and Abstracts Views on Vision4Press platform.
Data correspond to usage on the plateform after 2015. The current usage metrics is available 48-96 hours after online publication and is updated daily on week days.
Initial download of the metrics may take a while.