Fig. A.7
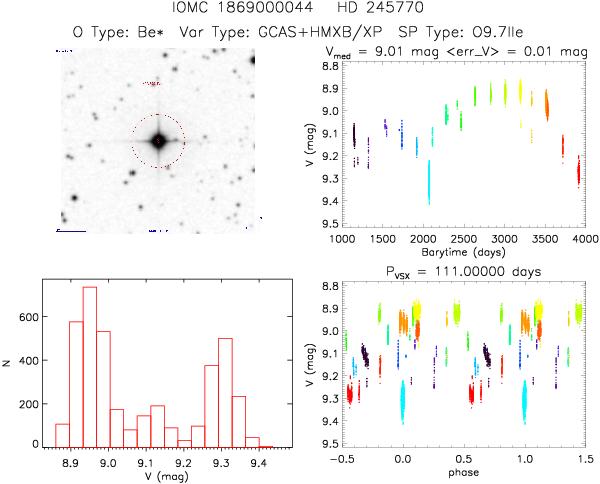
In the light curve of this high-mass X-Ray binary we see that a long term variation during the nearly 3000 days of monitoring dominates over the orbital period given by VSX. When there is no determination of the period from this work, the chart of the corresponding object includes a histogram of the observed magnitudes. The shape of these histograms helps to understand the variability pattern of the different objects.
Current usage metrics show cumulative count of Article Views (full-text article views including HTML views, PDF and ePub downloads, according to the available data) and Abstracts Views on Vision4Press platform.
Data correspond to usage on the plateform after 2015. The current usage metrics is available 48-96 hours after online publication and is updated daily on week days.
Initial download of the metrics may take a while.