Fig. 1
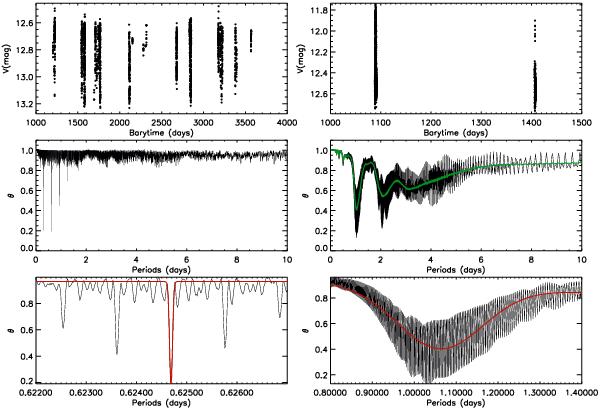
Visual description of the process of period determination for two different cases: a standard situation (analysis of IOMC 0460000022) on the left and an example of aliasing (IOMC 5228000021) on the right. In both cases, the plots are: top: the light curve without folding. For the light curve affected by aliasing the large temporal gap can be appreciated. Middle: periodogram from 0 to 10 days. The peaks are much narrower in the standard case. In the aliasing example, the smoothed periodogram taking into account the aliasing effect (see text) is overplotted in green. Bottom: detail of the method used to determine the uncertainty of the period. In red, the continuum plus gaussian fit to the peak is plotted.
Current usage metrics show cumulative count of Article Views (full-text article views including HTML views, PDF and ePub downloads, according to the available data) and Abstracts Views on Vision4Press platform.
Data correspond to usage on the plateform after 2015. The current usage metrics is available 48-96 hours after online publication and is updated daily on week days.
Initial download of the metrics may take a while.