Fig. 6
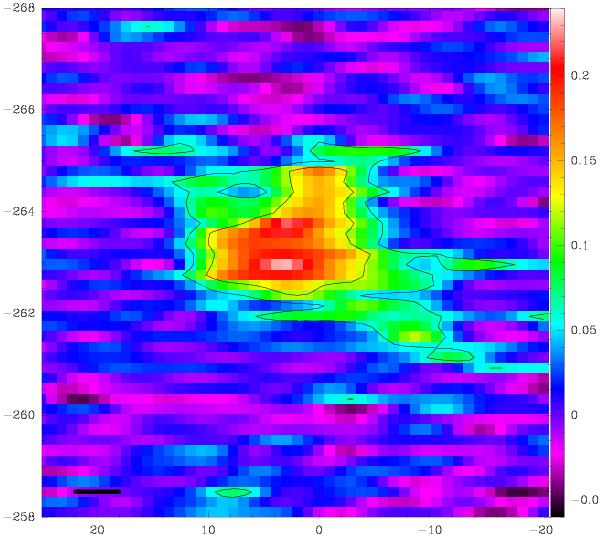
PV-diagram of the outer disk cloud along a cut with a position angle of 49° East of North, made with the datacube tapered at 90 m. The Y-axis indicates recession velocity in km s-1 from slower rotation (− 258 km s-1) to faster rotation velocities. The X-axis indicates the distance from the center in arcseconds, with negative values being to the south-west. The color scale is in Jy per beam. The bar to the lower left indicates 4′′, as the beam measures 4.50 × 3.49′′.
Current usage metrics show cumulative count of Article Views (full-text article views including HTML views, PDF and ePub downloads, according to the available data) and Abstracts Views on Vision4Press platform.
Data correspond to usage on the plateform after 2015. The current usage metrics is available 48-96 hours after online publication and is updated daily on week days.
Initial download of the metrics may take a while.