Fig. 5
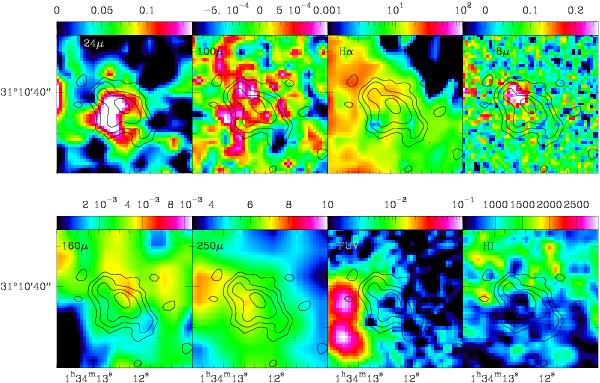
Comparison of the CO(1–0) emission at the resolution of the natural weighting – contours at 0.05, 0.1, 0.2, 0.3 Jy km s-1 – with the emission in the Far-IR(Tabatabaei et al. 2007; Kramer et al. 2010), Hα (arbitrary units), Far-UV (GALEX, arbitrary units), H i, and 8 μm PAH bands. From left to right (top row) units are: MJy/sr, Jy/pixel, arbitrary, MJy/sr and (bottom) Jy/pixel, MJy/sr, arbitrary, and integrated H i line intensity in K km s-1. Labels indicating the wavebands are provided in the upper left corners of each panel and the color wedge is shown above. The H i data is at the full 5″ resolution of the VLA mosaic described in Gratier et al. (2010).
Current usage metrics show cumulative count of Article Views (full-text article views including HTML views, PDF and ePub downloads, according to the available data) and Abstracts Views on Vision4Press platform.
Data correspond to usage on the plateform after 2015. The current usage metrics is available 48-96 hours after online publication and is updated daily on week days.
Initial download of the metrics may take a while.