Fig. 4
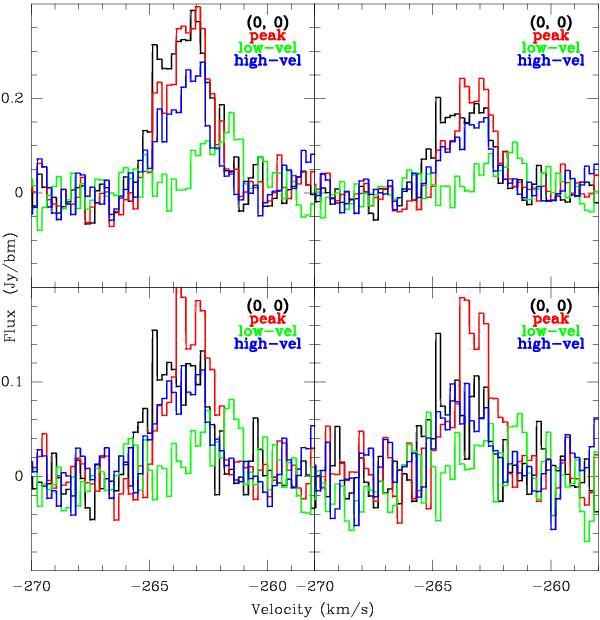
Spectra as a function of position in the cloud. The (0, 0) position refers to the cross in Fig. 3. The “peak” position corresponds to the triangle in the upper right panel of Fig. 3. The “high-vel” position corresponds to the triangle in the upper left panel of Fig. 3. The “low-vel” position corresponds to the triangle in the lower right panel of Fig. 3. The y-scale varies because the spectra are expressed in Jy/beam so the larger beams have greater fluxes. The tapered and untapered spectra are shown in the same order as in Fig. 2.
Current usage metrics show cumulative count of Article Views (full-text article views including HTML views, PDF and ePub downloads, according to the available data) and Abstracts Views on Vision4Press platform.
Data correspond to usage on the plateform after 2015. The current usage metrics is available 48-96 hours after online publication and is updated daily on week days.
Initial download of the metrics may take a while.