Fig. 8
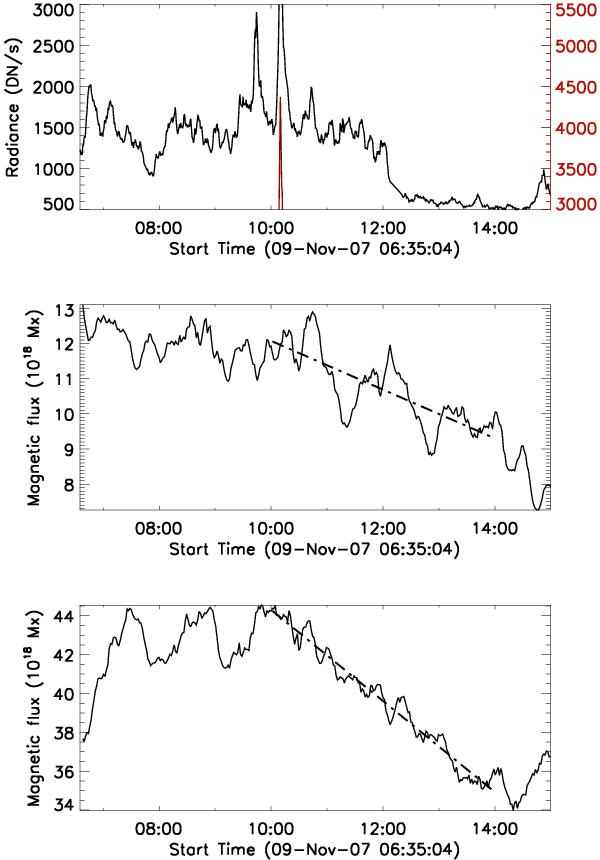
Lightcurves (top: X-ray radiance; middle: positive magnetic flux; bottom: negative magnetic flux) of a CH bright point that is marked as No. 1 event on November 9 in Fig. 1. The lightcurves are extracted from the FOV shown in Figs. 6, and 7. The time (x) axis is shown in unit of UT. For better scaling the peak of the X-ray lightcurve is cut off and resumed from bottom in red. The dash-doted-lines in the middle and bottom panels are linear fits of the corresponding magnetic flux from 10:00 UT to 14:00 UT.
Current usage metrics show cumulative count of Article Views (full-text article views including HTML views, PDF and ePub downloads, according to the available data) and Abstracts Views on Vision4Press platform.
Data correspond to usage on the plateform after 2015. The current usage metrics is available 48-96 hours after online publication and is updated daily on week days.
Initial download of the metrics may take a while.