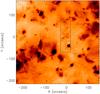
Fig. 1
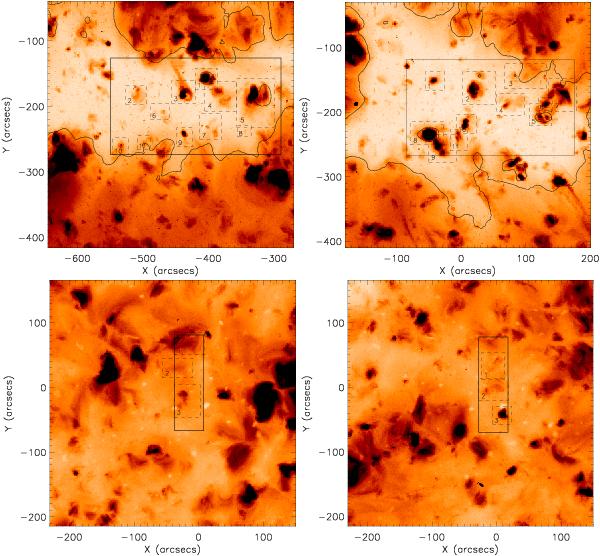
Generated X-ray images (see the text in Sect. 2.2) of an equatorial CH on 2007 November 9 (top left) and November 12 (top right), the quiet Sun 2009 January 10 (bottom left) and January 13 (bottom right). The images are shown with an inverted colour table. The SOT/Hinode field-of-views are marked as rectangles (solid lines). Features within the dashed-line boxes are the events studied in this paper. For the two CH datasets shown in the top panel, the black solid contour plot outlines the coronal hole boundary as seen at the beginning of each observing period.
Current usage metrics show cumulative count of Article Views (full-text article views including HTML views, PDF and ePub downloads, according to the available data) and Abstracts Views on Vision4Press platform.
Data correspond to usage on the plateform after 2015. The current usage metrics is available 48-96 hours after online publication and is updated daily on week days.
Initial download of the metrics may take a while.