Fig. 10
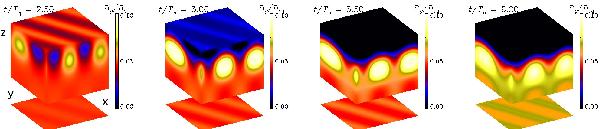
Visualization of By on the periphery of
the computational domain for 4 times (normalized in terms of
Tη) during the nonlinear stage of the
instability for θ = 0° (corresponding to the north pole) and
Co = 0.03, corresponding to 2Ω/λ ∗ 0 ≈ 1.3. Time is here
given in units of  .
.
Current usage metrics show cumulative count of Article Views (full-text article views including HTML views, PDF and ePub downloads, according to the available data) and Abstracts Views on Vision4Press platform.
Data correspond to usage on the plateform after 2015. The current usage metrics is available 48-96 hours after online publication and is updated daily on week days.
Initial download of the metrics may take a while.