Fig. 2
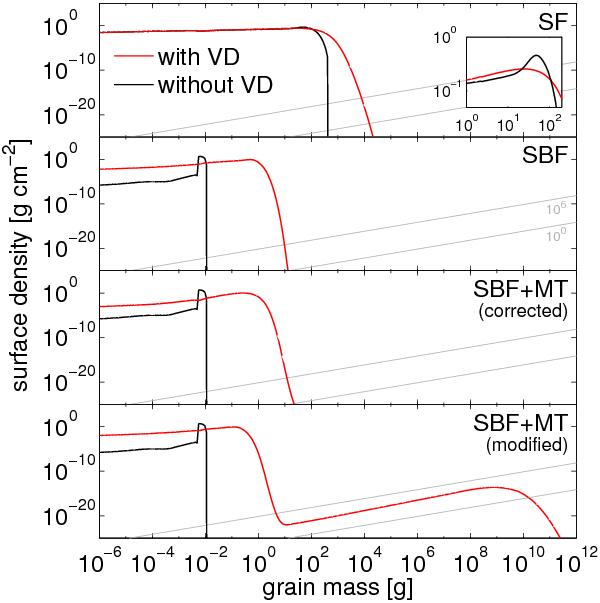
Snapshot of the size distributions for the SF, SBF, corrected SBF+MT, and modified SBF+MT collision models taken at 1 AU after t = 5×10⁴ years, both with (red) and without (black) a velocity distribution (VD). The gray diagonal lines correspond to a total of 1 and 106 particles within a 0.1 AU annulus. The inset in the top panel shows an enlargement of the two peaks in the SF model.
Current usage metrics show cumulative count of Article Views (full-text article views including HTML views, PDF and ePub downloads, according to the available data) and Abstracts Views on Vision4Press platform.
Data correspond to usage on the plateform after 2015. The current usage metrics is available 48-96 hours after online publication and is updated daily on week days.
Initial download of the metrics may take a while.