Fig. 7
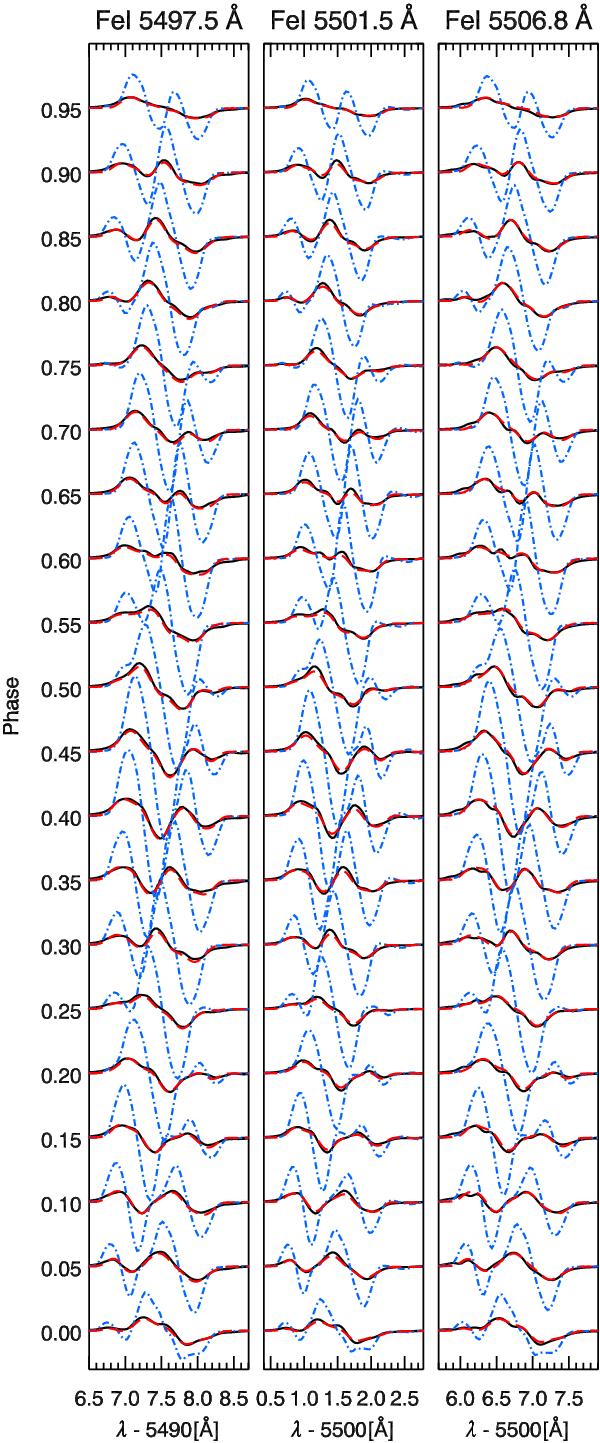
Line profiles from forward and inverse calculations. The black and red lines correspond to the line profiles from forward and inverse calculations respectively of a stellar surface with magnetic spots and cool temperature spots. The blue lines represents line profiles from forward calculations of a stellar surface with magnetic spots and a homogeneous temperature distribution.
Current usage metrics show cumulative count of Article Views (full-text article views including HTML views, PDF and ePub downloads, according to the available data) and Abstracts Views on Vision4Press platform.
Data correspond to usage on the plateform after 2015. The current usage metrics is available 48-96 hours after online publication and is updated daily on week days.
Initial download of the metrics may take a while.