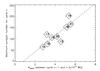
Fig. 4
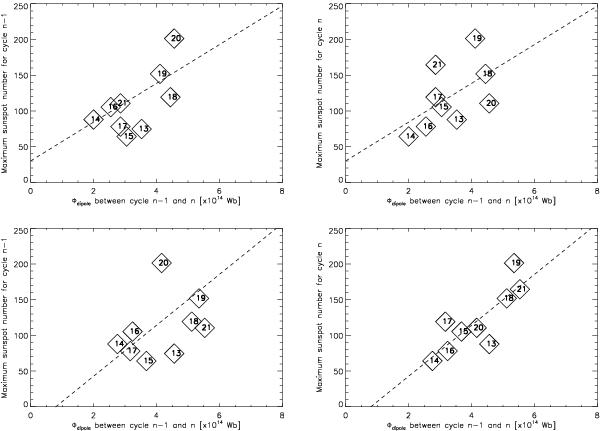
Correlation diagrams for the maxima of Φdipole during activity minima between cycles n − 1 and n from the SFT simulation vs. the maxima of the sunspot number of the the cycle preceding the minimum (n − 1, left panels) and of the subsequent cycle (n, right panels), respectively. Upper row: case without inflows; lower row: reference case with inflows. Numbers within symbols give the index, n, of the cycle following the respective activity minimum. Linear regressions are indicated by the dashed lines.
Current usage metrics show cumulative count of Article Views (full-text article views including HTML views, PDF and ePub downloads, according to the available data) and Abstracts Views on Vision4Press platform.
Data correspond to usage on the plateform after 2015. The current usage metrics is available 48-96 hours after online publication and is updated daily on week days.
Initial download of the metrics may take a while.