Fig. 3
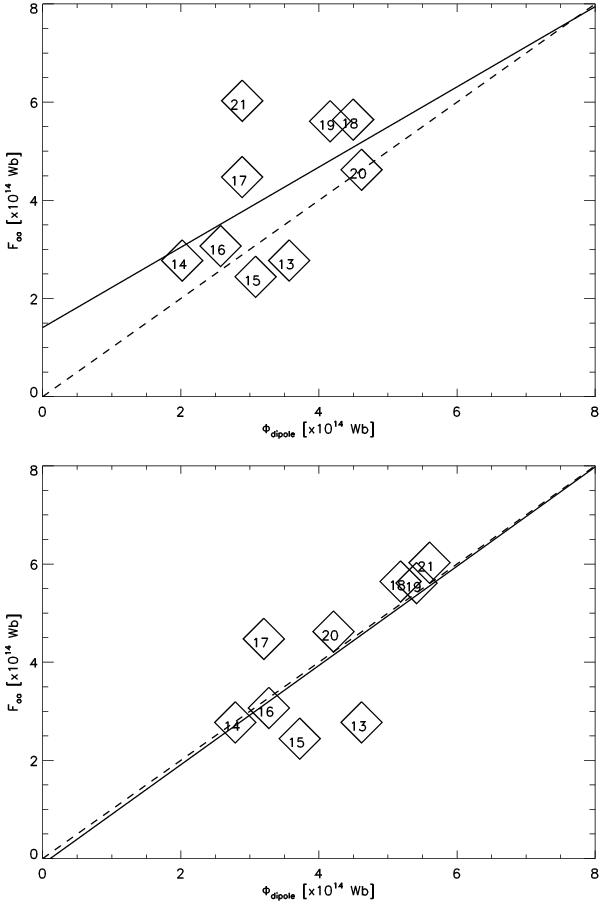
Maxima of Φdipole from SFT simulations vs. open flux during activity minima as determined from the measured geomagnetic aa-index (Lockwood et al. 2009). Upper panel: case without inflows. Lower panel: reference case with inflows. Numbers within symbols give the index of the cycle following the respective activity minimum. Full lines indicate regression curves, dashed lines the bisectrix of the first quarter plane.
Current usage metrics show cumulative count of Article Views (full-text article views including HTML views, PDF and ePub downloads, according to the available data) and Abstracts Views on Vision4Press platform.
Data correspond to usage on the plateform after 2015. The current usage metrics is available 48-96 hours after online publication and is updated daily on week days.
Initial download of the metrics may take a while.