Fig. 2
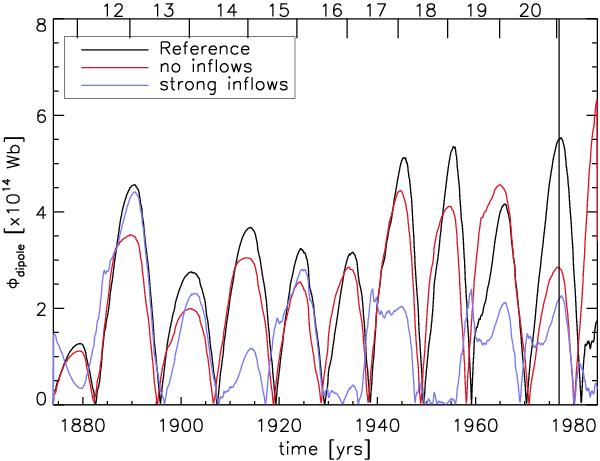
Magnetic flux corresponding to the axial dipole, Φdipole, from the SFT simulation with inflows (reference case, black curve), without inflows (red curve), and with strong inflows (amplitude multiplied by 1.5 with respect to the reference case, blue curve). The black vertical line indicates the termination of the RGO sunspot data in 1976.
Current usage metrics show cumulative count of Article Views (full-text article views including HTML views, PDF and ePub downloads, according to the available data) and Abstracts Views on Vision4Press platform.
Data correspond to usage on the plateform after 2015. The current usage metrics is available 48-96 hours after online publication and is updated daily on week days.
Initial download of the metrics may take a while.