Fig. 1
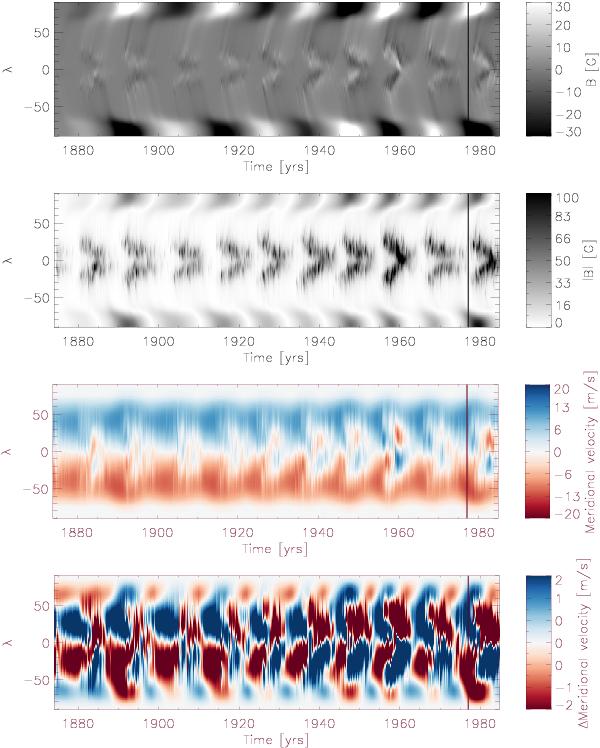
Time-latitude diagrams of various quantities from a SFT simulation run with magnetic-field dependent meridional inflows towards the activity belts. From top to bottom: longitudinally averaged signed radial magnetic field, longitudinally averaged unsigned radial magnetic field, meridional flow velocity, and meridional flow perturbation (Δν(λ,t), saturated for values exceeding ± 2 m s-1). Black vertical lines indicate the termination of the RGO sunspot data in 1976.


Current usage metrics show cumulative count of Article Views (full-text article views including HTML views, PDF and ePub downloads, according to the available data) and Abstracts Views on Vision4Press platform.
Data correspond to usage on the plateform after 2015. The current usage metrics is available 48-96 hours after online publication and is updated daily on week days.
Initial download of the metrics may take a while.