Fig. 4
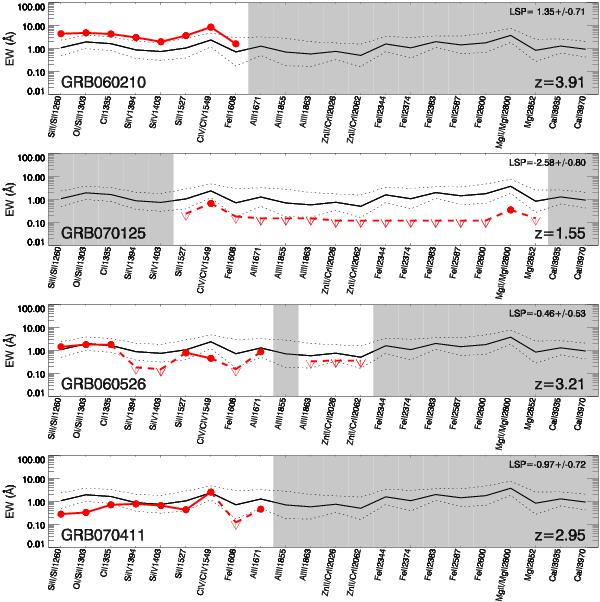
EW diagrams: in red we represent the EWs of the spectral features if each afterglow spectrum. The continuous black line is the average of the sample of GRBs (see Fig. 2), whereas the dotted lines indicate the standard deviations over and under this value. Gray regions mark the range where there is no spectral coverage or it is affected by strong telluric features. Each panel shows examples of individual bursts: GRB 060210, an afterglow with strong lines; GRB 070125, with weak features; GRB 060526, with a very weakly ionised environment; GRB 070411, with very high ionisation.
Current usage metrics show cumulative count of Article Views (full-text article views including HTML views, PDF and ePub downloads, according to the available data) and Abstracts Views on Vision4Press platform.
Data correspond to usage on the plateform after 2015. The current usage metrics is available 48-96 hours after online publication and is updated daily on week days.
Initial download of the metrics may take a while.