Free Access
Fig. C.1
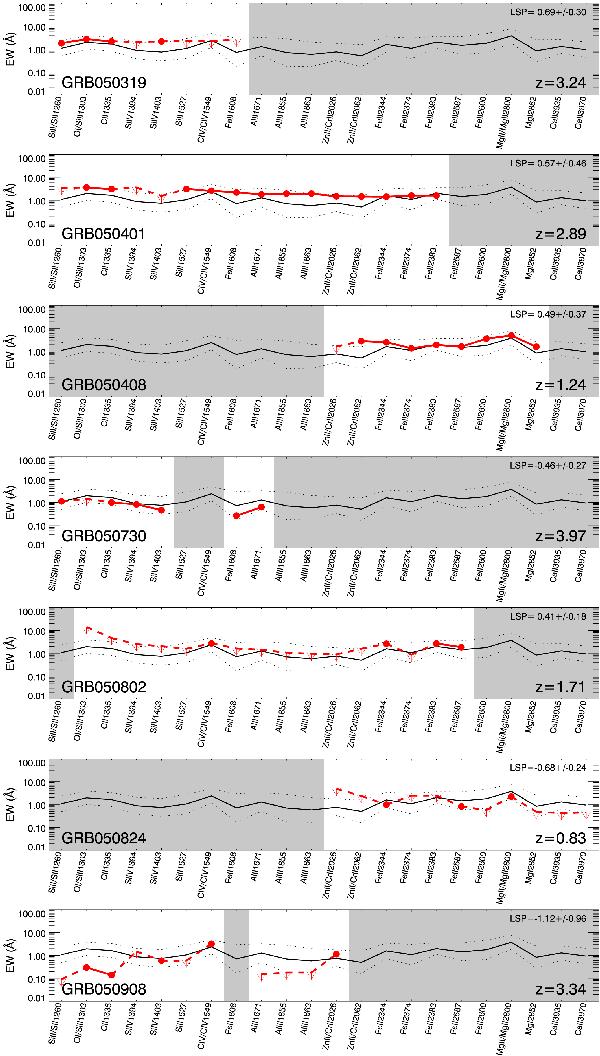
Catalogue of GRBs and their spectral features. The GRB measurements are shown in red, while the average values and standard deviations of the fits for the complete sample are drawn in red. The plots also indicate the redshift of the GRB and the LSP. The shaded regions indicate regions of the spectra where there is no data.
Current usage metrics show cumulative count of Article Views (full-text article views including HTML views, PDF and ePub downloads, according to the available data) and Abstracts Views on Vision4Press platform.
Data correspond to usage on the plateform after 2015. The current usage metrics is available 48-96 hours after online publication and is updated daily on week days.
Initial download of the metrics may take a while.