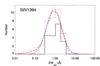
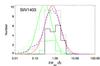
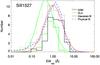
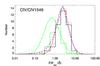
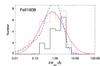
Fig. B.1
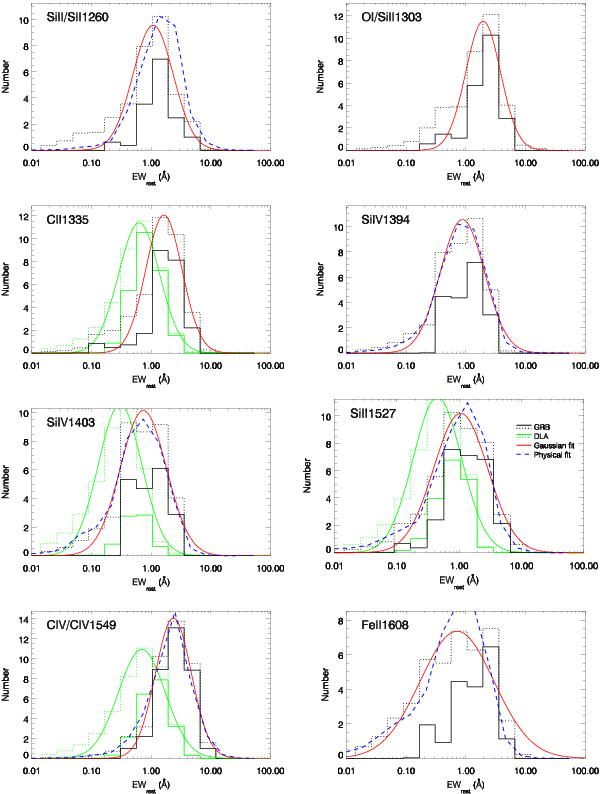
EW distribution of the different spectral features. The thick black line histogram indicates only detections, whereas the dotted histogram includes also the limits. The red line is the best fit of the complete histogram with a lognormal distribution. In some cases there is a dashed blue line for the physical fit, as described in Sect. 3.4. In green we show a histogram of EWs, and its correspondent lognormal fit, of a sample of DLA systems (see Sect. 3.3) for a subsample of lines.
Current usage metrics show cumulative count of Article Views (full-text article views including HTML views, PDF and ePub downloads, according to the available data) and Abstracts Views on Vision4Press platform.
Data correspond to usage on the plateform after 2015. The current usage metrics is available 48-96 hours after online publication and is updated daily on week days.
Initial download of the metrics may take a while.