Fig. 20
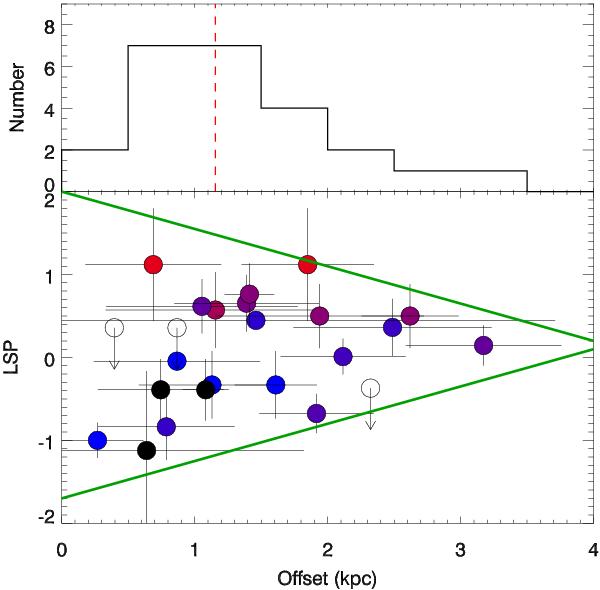
Bottom: relation of the LSP with the projected offset between the afterglow and the host galaxy. The colour coding indicates the extinction of the afterglow, being red the most extinguished and blue the least ones, those bursts without a reliable extinction measurement are indicated in black. Green lines are qualitative indicators of the distribution limits. Top: histogram of offsets. The red-dashed line indicates the median offset.
Current usage metrics show cumulative count of Article Views (full-text article views including HTML views, PDF and ePub downloads, according to the available data) and Abstracts Views on Vision4Press platform.
Data correspond to usage on the plateform after 2015. The current usage metrics is available 48-96 hours after online publication and is updated daily on week days.
Initial download of the metrics may take a while.