Fig. 9
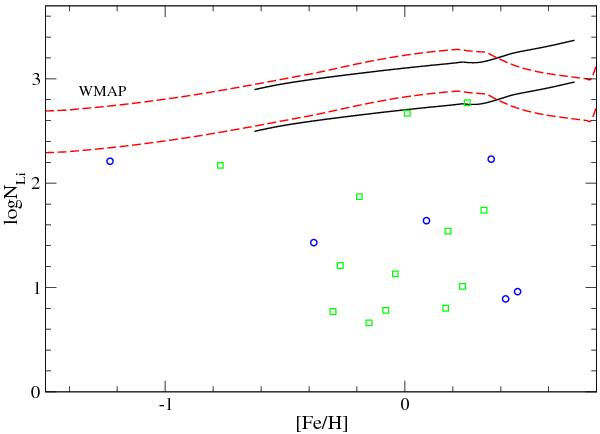
Predicted evolution of Li abundance for the gas in the MP and MR populations (see details in the text) compared with Li abundance determinations by Bensby et al. (2011), blue circle, and by Gonzalez et al. (2009), green square. The dashed red curve refers to the MP and the continuous black curve to the MR population. The star MOA-2010-BLG-285S corresponds to the point with [Fe/H] = −1.23 dex and log N(Li) = 2.16. We show also our predictions based on the assumption of the primordial Li abundance suggested by WMAP results.
Current usage metrics show cumulative count of Article Views (full-text article views including HTML views, PDF and ePub downloads, according to the available data) and Abstracts Views on Vision4Press platform.
Data correspond to usage on the plateform after 2015. The current usage metrics is available 48-96 hours after online publication and is updated daily on week days.
Initial download of the metrics may take a while.