Free Access
Fig. 3
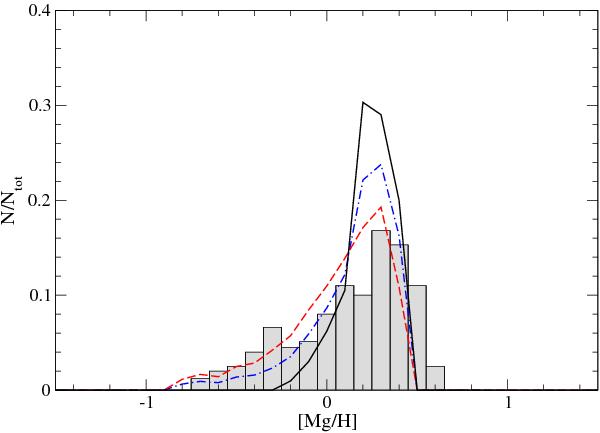
Predicted MDF for the two populations: MP (red dashed line) and MR (black continuous line) as functions of [Mg/H]. The data are from Hill et al. (2011). The sum of the two distributions is also shown (blue dashed-dotted line).
Current usage metrics show cumulative count of Article Views (full-text article views including HTML views, PDF and ePub downloads, according to the available data) and Abstracts Views on Vision4Press platform.
Data correspond to usage on the plateform after 2015. The current usage metrics is available 48-96 hours after online publication and is updated daily on week days.
Initial download of the metrics may take a while.