Fig. 4
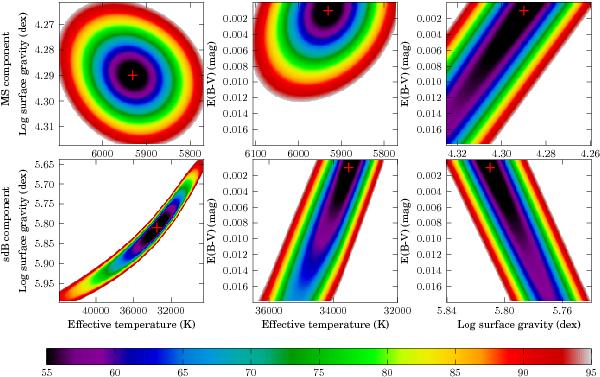
The confidence intervals of the SED fit of PG 1104+243. The upper row show distributions for the main-sequence component, the lower row for the subdwarf component. The best fit results are indicated with a red cross. The different colors show the cumulative density probability connected to the χ2 statistics given by Eq. (6), with the χ2 values of the grids rescaled by a factor of 1.26.
Current usage metrics show cumulative count of Article Views (full-text article views including HTML views, PDF and ePub downloads, according to the available data) and Abstracts Views on Vision4Press platform.
Data correspond to usage on the plateform after 2015. The current usage metrics is available 48-96 hours after online publication and is updated daily on week days.
Initial download of the metrics may take a while.