Fig. 6
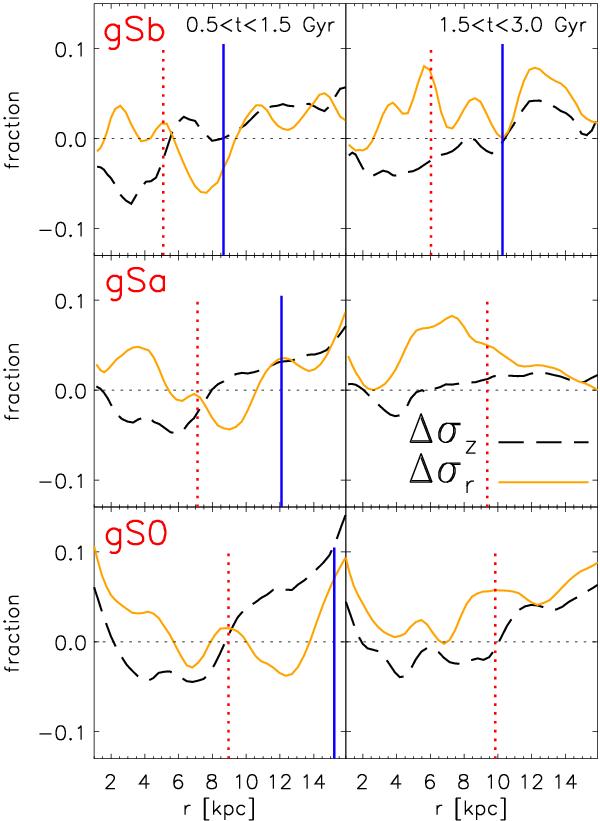
Fractional changes in σz(r) and σr(r) resulting from the migrated stars. The dashed black curve plots the quantity  , where σz,all and
  are the vertical velocity dispersions obtained from the total population and the non-migrators, respectively. A similar expression estimates Δσr, shown by the solid orange curve. The dotted-red and solid-blue vertical lines denote the bar’s CR and OLR, corresponding to the final time shown in each time period. Note the inverse correlation between Δσz and Δσr, indicating coupling between the radial and vertical motions of stars.
Current usage metrics show cumulative count of Article Views (full-text article views including HTML views, PDF and ePub downloads, according to the available data) and Abstracts Views on Vision4Press platform.
Data correspond to usage on the plateform after 2015. The current usage metrics is available 48-96 hours after online publication and is updated daily on week days.
Initial download of the metrics may take a while.