Fig. 1
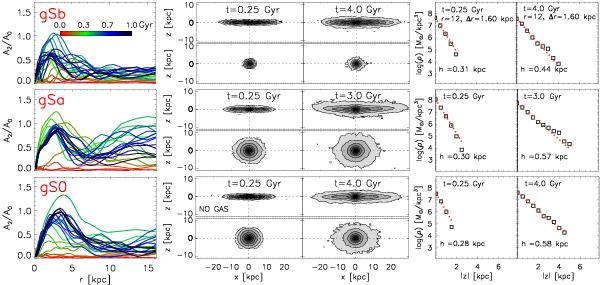
First column: m=2 Fourier amplitudes, A2, as a function of time (color bar) for our model galaxies. Columns 2–3: edge-on view for each disc and bulge (separately) for earlier and later times of their evolution, as indicated in each panel. Columns 4–5: scale-heights, h, at ~2.5 disc scale-lengths. The dotted red line shows a single exponential fit. Note that in 3–4 Gyr of evolution with strong perturbation from bars and spirals, h only doubles despite the efficient stellar radial migration.
Current usage metrics show cumulative count of Article Views (full-text article views including HTML views, PDF and ePub downloads, according to the available data) and Abstracts Views on Vision4Press platform.
Data correspond to usage on the plateform after 2015. The current usage metrics is available 48-96 hours after online publication and is updated daily on week days.
Initial download of the metrics may take a while.