Fig. 6
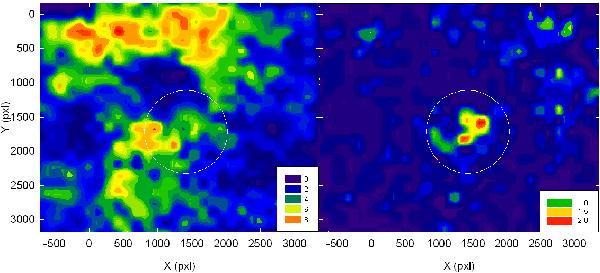
The left panel is the contour plot showing the star density in the surveyed area generated approximately with 9000 stars. The insert gives the number of stars per half-minute squared box. The right panel shows the contour plot of those stars earlier than B5-type (see text). The insert as in the left panel. The 600 pxl circle indicates the region assumed to be the core of the cluster.
Current usage metrics show cumulative count of Article Views (full-text article views including HTML views, PDF and ePub downloads, according to the available data) and Abstracts Views on Vision4Press platform.
Data correspond to usage on the plateform after 2015. The current usage metrics is available 48-96 hours after online publication and is updated daily on week days.
Initial download of the metrics may take a while.