Fig. 7
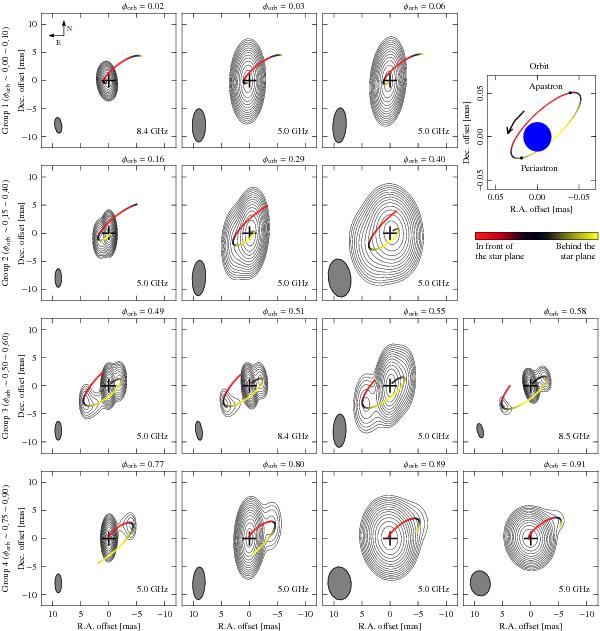
Synthetic images produced with our model, computed for the corresponding orbital phases of the different VLBI projects and convolved with the corresponding beam shown in Fig. 4. The black line traces the projected position of the flow axis of cooling particles, which is computed for linear distances from the star between 1.6 and 22 AU. The crosses mark the position of the main star, set at the origin. The panel in the top-right corner shows the system orbit, projected with an inclination of 70° and a longitude of the ascending node of 130°.
Current usage metrics show cumulative count of Article Views (full-text article views including HTML views, PDF and ePub downloads, according to the available data) and Abstracts Views on Vision4Press platform.
Data correspond to usage on the plateform after 2015. The current usage metrics is available 48-96 hours after online publication and is updated daily on week days.
Initial download of the metrics may take a while.