Fig. 6
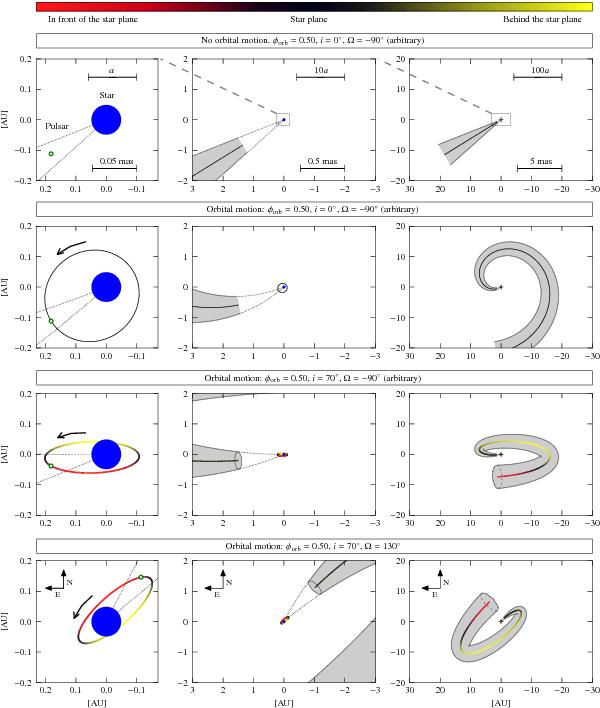
Sketch of the orbit orientation and the emission region of the model. From left to right the panels show three different scales: the orbit (a), the acceleration region (10a), and the whole flow (100a). The particle acceleration occurs at a distance of 10a from the massive star (blue circle) behind the pulsar (empty green circle) and the flow of emitting particles (grey area) expands, forming a cone while travelling away from the binary system. The star plane is the plane of the sky intersecting the star. The colours in the orbit and the flow indicate regions situated in front of the star plane (red, closer to the observer than the star) and behind the plane (yellow, farther away than the star). The curved arrows indicate the orbital motion of the pulsar. The first row shows the general scenario without orbital motion, whereas the rest of the rows include the orbital motion and different projections of the orbit, indicated in the labels. The last row of panels shows the orbit projected with our best estimate of i and Ω.
Current usage metrics show cumulative count of Article Views (full-text article views including HTML views, PDF and ePub downloads, according to the available data) and Abstracts Views on Vision4Press platform.
Data correspond to usage on the plateform after 2015. The current usage metrics is available 48-96 hours after online publication and is updated daily on week days.
Initial download of the metrics may take a while.