Fig. 6
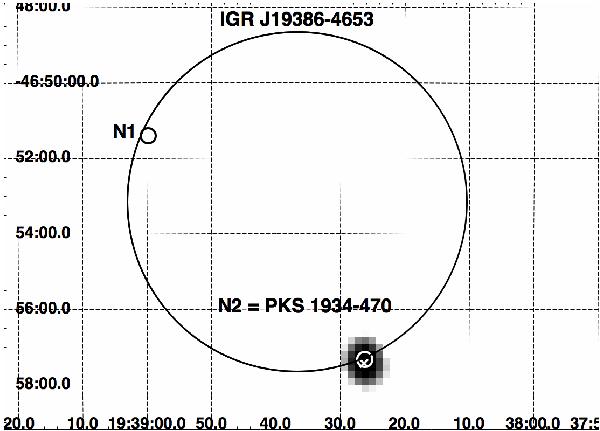
SUMSS 0.8 GHz image of the region surrounding IGR J19386−4653. The large circle refers to the IBIS positional uncertainty, and the smaller ones to the the position of the two XRT detections. The X-ray source N1 is not detected in radio, while source N2 is coincident with the CRATES/PKS source (indicated with an X-shaped symbol).
Current usage metrics show cumulative count of Article Views (full-text article views including HTML views, PDF and ePub downloads, according to the available data) and Abstracts Views on Vision4Press platform.
Data correspond to usage on the plateform after 2015. The current usage metrics is available 48-96 hours after online publication and is updated daily on week days.
Initial download of the metrics may take a while.