Free Access
Fig. 4
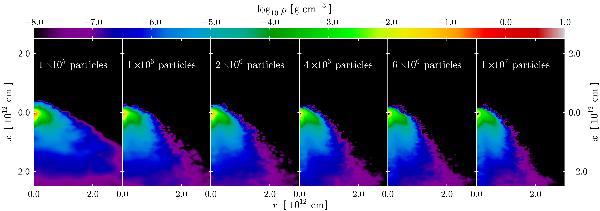
Density distribution of the companion star in the ms_22a model at 3000 s after supernova explosion with different resolutions. Density is color-coded logarithmically.
Current usage metrics show cumulative count of Article Views (full-text article views including HTML views, PDF and ePub downloads, according to the available data) and Abstracts Views on Vision4Press platform.
Data correspond to usage on the plateform after 2015. The current usage metrics is available 48-96 hours after online publication and is updated daily on week days.
Initial download of the metrics may take a while.