Free Access
Fig. 1
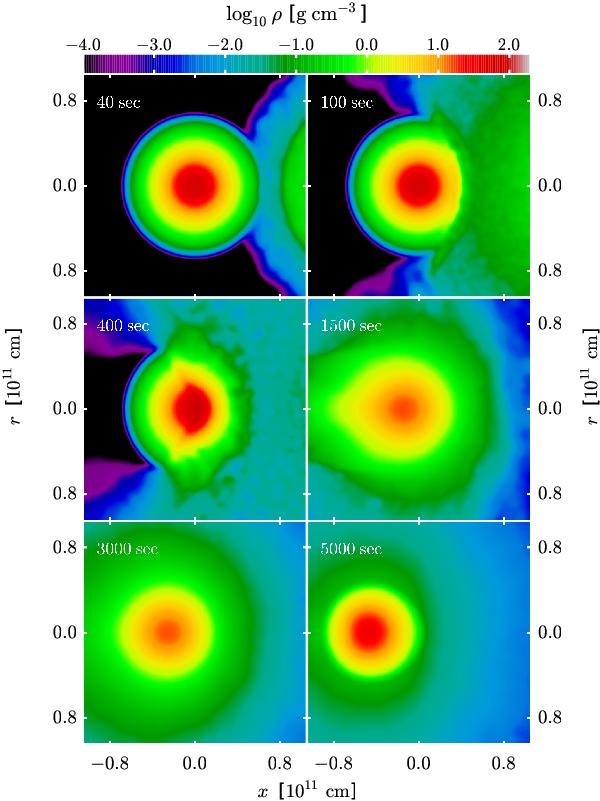
Time evolution of density distribution in the impact simulation with model ms_22a. For visualization (not for the simulation, though), we use cylindrical coordinates. The radial coordinate is averaged over angle accounting for the intrinsic symmetry of the star. The logarithm of density is color–coded.
Current usage metrics show cumulative count of Article Views (full-text article views including HTML views, PDF and ePub downloads, according to the available data) and Abstracts Views on Vision4Press platform.
Data correspond to usage on the plateform after 2015. The current usage metrics is available 48-96 hours after online publication and is updated daily on week days.
Initial download of the metrics may take a while.