Fig. 5
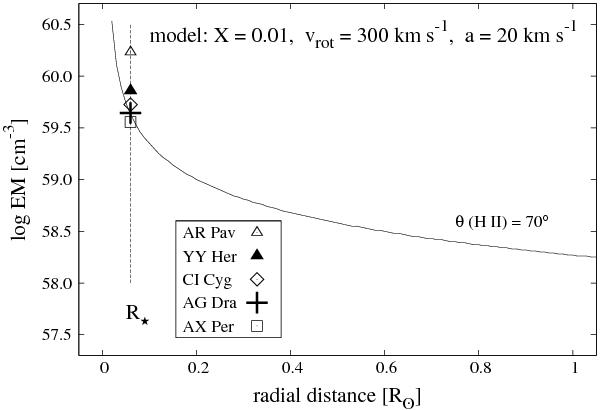
Comparison of the model emission measure calculated according to Eq. (21) throughout the H ii region as a function of the radial distance r (solid line) with the values derived from the spectra of selected symbiotic stars during active phases (Table 1). θ(H ii) is the opening angle of the H ii zone. The same model as in Fig. 4 was selected.
Current usage metrics show cumulative count of Article Views (full-text article views including HTML views, PDF and ePub downloads, according to the available data) and Abstracts Views on Vision4Press platform.
Data correspond to usage on the plateform after 2015. The current usage metrics is available 48-96 hours after online publication and is updated daily on week days.
Initial download of the metrics may take a while.