Fig. 8
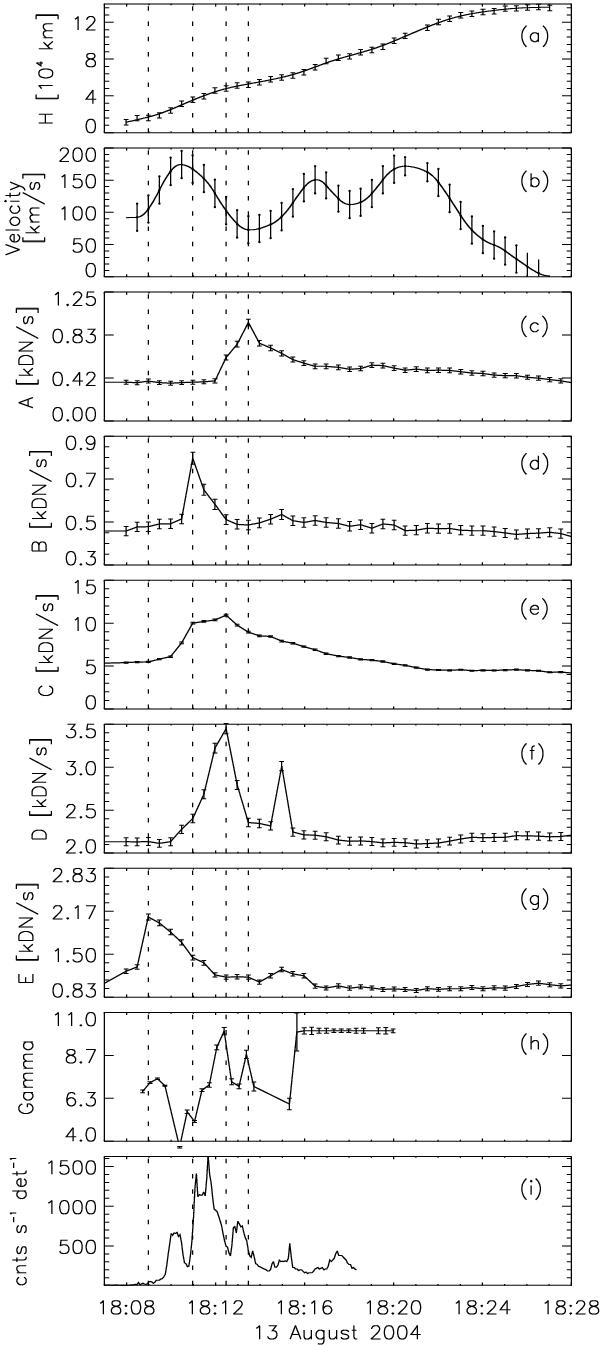
SOL2004-08-13T18:12. Panels a) and b) show height and velocity against time. The height measurements were fitted with cubic splines. The velocity is a derivative of the obtained fit. Panels c)–g) present light curves for the brightening regions A, B, C, D, and E. Panel h) shows gamma against time. Panel i) shows the HXR light curve obtained from the RHESSI (25–50 keV). The vertical dashed lines represent maxima of light curves for brightening regions in all panels.
Current usage metrics show cumulative count of Article Views (full-text article views including HTML views, PDF and ePub downloads, according to the available data) and Abstracts Views on Vision4Press platform.
Data correspond to usage on the plateform after 2015. The current usage metrics is available 48-96 hours after online publication and is updated daily on week days.
Initial download of the metrics may take a while.